

This came out of a conversation with one of our engineers about a production incident she'd just been through. It sounded small at first (a pod got evicted, came back in seconds) but the more we talked through it the more it looked like a problem anyone running OTel Collector at real scale eventually runs into. We've generalised the details below, but the architecture, the numbers, and the failure mode are all real.
Push vs. Pull, quickly
Push receivers are ones where the sender initiates the connection. For example, an app instruments itself with an OTel SDK and actively sends telemetry to the collector, the collector just listens and accepts what arrives.
Pull receivers work the opposite way, the collector initiates the connection, reaching out to poll or scrape a target on its own schedule, whether that's a Prometheus-style metrics endpoint or a database connection.
Who reaches out to whom is what ends up mattering for how each one scales.
The incident
It started as a non-event. A routine node replacement, initiated by GCP, rescheduled the pod, the pod came back up within seconds, and nothing in the dashboards showed sustained downtime. On paper, nothing worth writing up.
Except the pod that got evicted was the gateway collector, the single point every trace, log line, and business metric passed through before reaching the backend. There was no second copy of it running anywhere. The obvious fix sounds simple: run more than one. It isn't, and figuring out why is really what this post is about.
The recovery happened to be fast this time. Being fast recovery this time doesn't mean it will be so in the future. If that node had taken longer to come back, or the replacement had failed too, every span and log line in flight during that window would have been gone for good. With push, once the collector that received the data is gone, so is the data. There's no upstream system still holding a copy to resend, unlike pull, where the source itself retains its own state and a missed scrape just means scraping again next cycle. This wasn't really an availability incident. It only avoided being a data loss incident by luck.
There was a PodDisruptionBudget sitting right there in the config, minAvailable: 1. It didn't help at all. Figuring out why is what turned a five minute non-incident into an actual redesign conversation.
What the setup looked like
Built on the upstream OpenTelemetry Collector chart, deployed as two tiers:
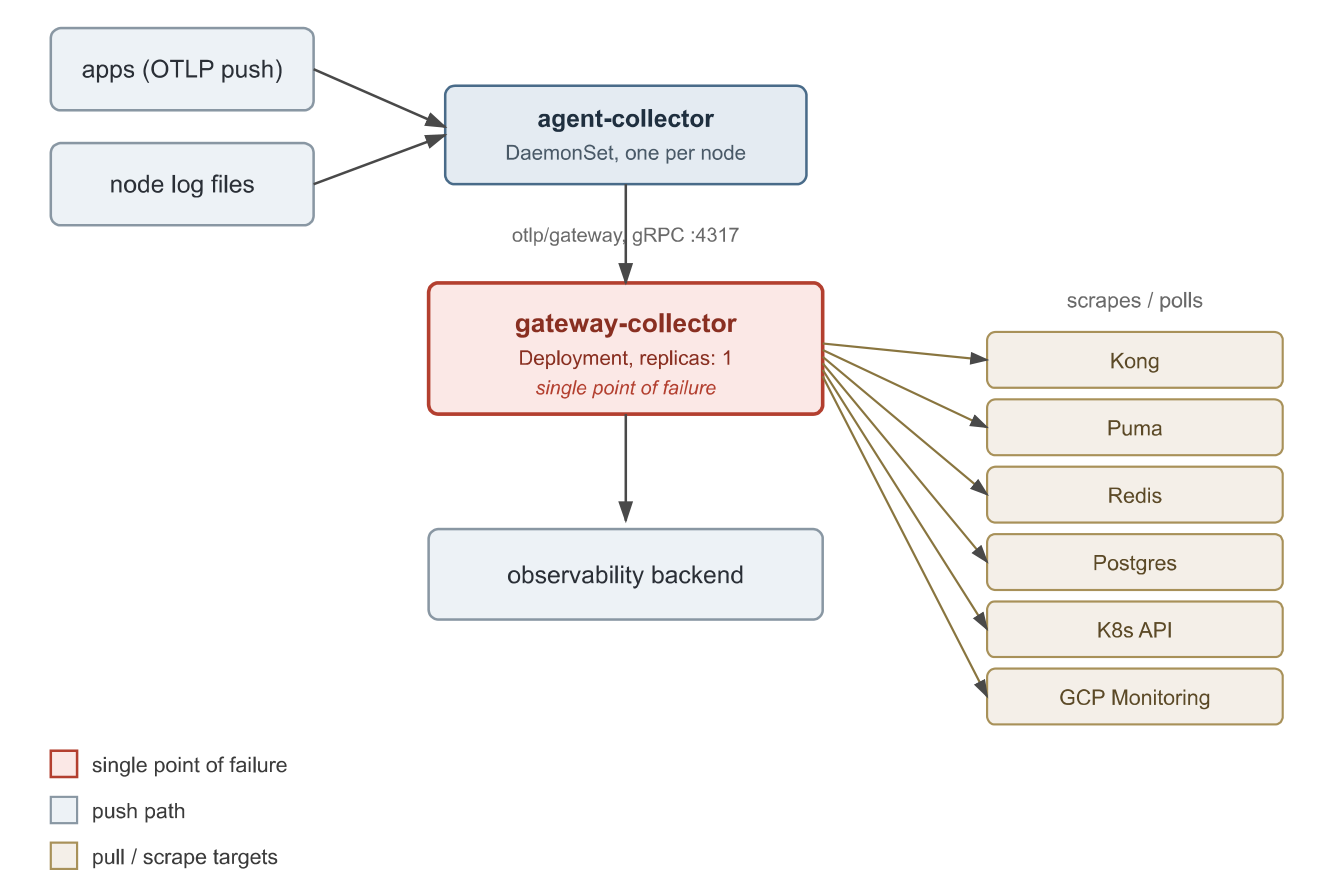
- agent-collector runs one pod per node. It picks up OTLP push traffic from apps on that node and tails node level log files directly off disk, the approach this setup uses. That's the reason it has to be a DaemonSet in the first place, since with file-based tailing the logs are only visible locally on that node.
- gateway-collector is where it gets interesting, and where the stakes flip. Every per-node agent forwards into it, so unlike the agent tier, this isn't one of several instances with a contained blast radius, it's the single point every trace, log line, and metric from the entire cluster converges through, all push traffic funnelled into one pipeline. Whatever happens here affects everything, not a fraction of it. On top of that, it also owns every pull based receiver: Kong, Puma, Redis, Postgres, the K8s API, GCP Monitoring. One process, one replica, doing two jobs that don't behave the same way under load, and carrying all of it at once.
The same pattern is deployed across multiple environments, config layered as a base plus per-environment overrides.
Why the PDB didn't catch anything
Seeing a single-replica Deployment carrying this much weight, the first instinct is to check for a PodDisruptionBudget, and there was one: minAvailable: 1. It reads like a guarantee. It isn't.
A PDB only constrains voluntary disruptions, the kind Kubernetes itself initiates and can therefore choose to delay: draining a node, a rolling update, a scale-down. On a Deployment with exactly one replica, minAvailable: 1 is close to a no-op, since evicting the only pod would violate the budget and gets blocked, but that's the only scenario it blocks. A node dying outright, hardware failure, an unresponsive kubelet, the instance getting terminated, is an external factor, something outside the Kubernetes control plane's own decision-making. A PDB doesn't act on external factors like this at all, it only governs disruptions the control plane itself chooses to make. The pod is gone either way.
So the safety net everyone assumed was there was only ever covering the one failure mode that wasn't actually a threat. The thing that did happen, a node just disappearing, was never something a PDB could have stopped.
Why "just add replicas" doesn't work
The obvious next move is bumping replicas: 1 to something higher and spreading pods across nodes. It solves half the problem and creates a new one.
For push, more replicas is genuinely good news. OTLP receivers don't care which replica handles which span (except if you are doing tail sampling), so any pod behind a load balancer works fine. That side is basically solved by scaling out.
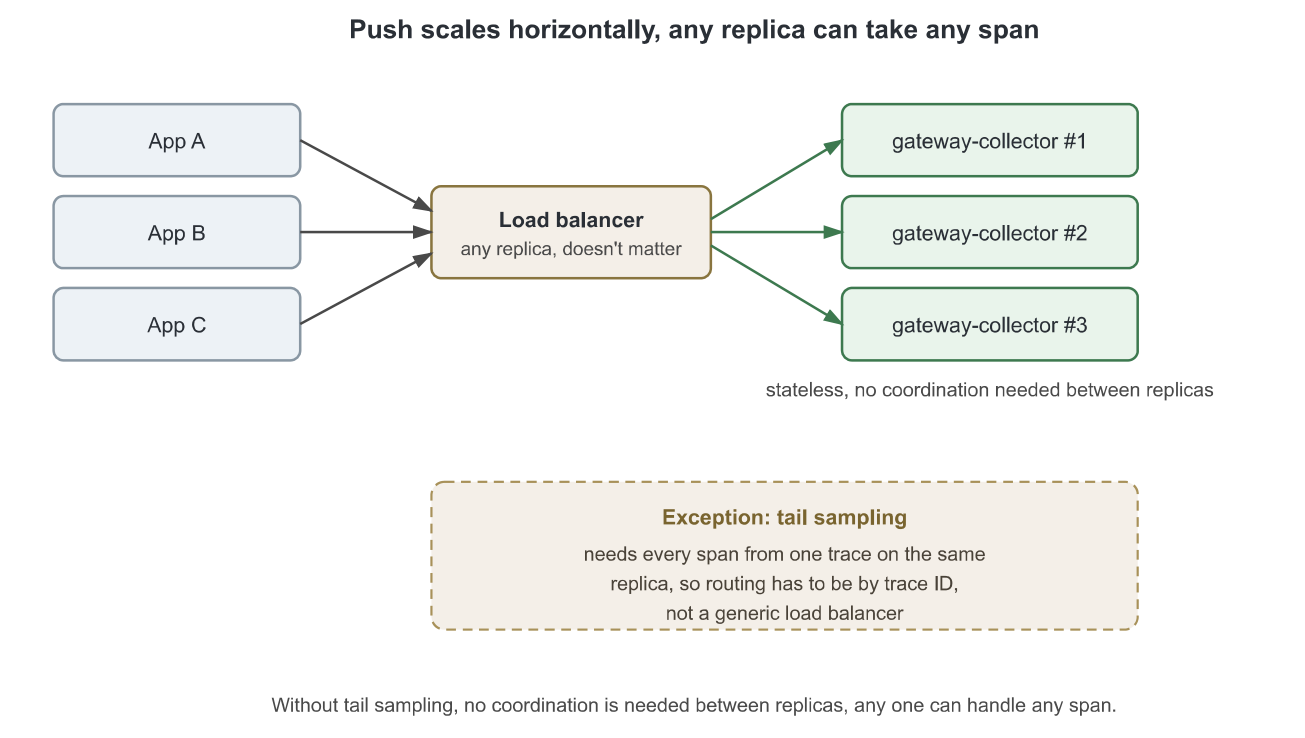
Without tail sampling, no coordination is needed between replicas, any one can handle any span.
Pull doesn't behave the same way, and not even uniformly within itself, some of the pull receivers here would duplicate data under more replicas, others never needed more replicas to begin with. That distinction is worth its own section, below.
How much traffic we're actually talking about
A few numbers worth knowing before redesigning anything: push volume ran around 265 spans a second, about 23 million spans a day, plus roughly 11.5 million log records a day and around 60,000 metric data points a day from a handful of business metrics.
Pull was smaller and uneven. Postgres alone accounted for 28,293 samples every 60 seconds, about 41 million a day, outpacing Kong (~525 samples across two pods every 15 seconds, about 6 million a day) and Puma (40 to 50 every 30 seconds, roughly 130,000 a day), against only 5 to 8 pull targets total.
That asymmetry is why push was the bigger risk: if it's lost before export, there's nowhere else to get it from, while a missed pull scrape just means scraping again next cycle. Pull still turned out to be the harder engineering problem, not because of volume, but because of target ownership among multiple replicas of the same receiver.
Both tiers ran a default in-memory sending queue:
exporters:
  otlp:
    sending_queue:
      queue_size: 1000
      # in-memory by default
    retry_on_failure:
      max_elapsed_time: 300s
That's a quiet risk of its own, separate from replica count: anything queued when a pod gets killed, not gracefully stopped, killed, is gone regardless of how many replicas exist elsewhere.
There's a second way to lose data here that has nothing to do with the pod dying at all: retry_on_failure.max_elapsed_time defaults to 300 seconds. If the backend is unreachable for longer than that, five minutes of retries, the collector gives up on that data and drops it, on purpose, even though the pod stayed healthy the whole time.
The pull side isn't one problem, it's several
It's tempting to treat "fix the pull side" as a single fix, and it isn't, because these receivers don't all behave the same way once you add replicas.
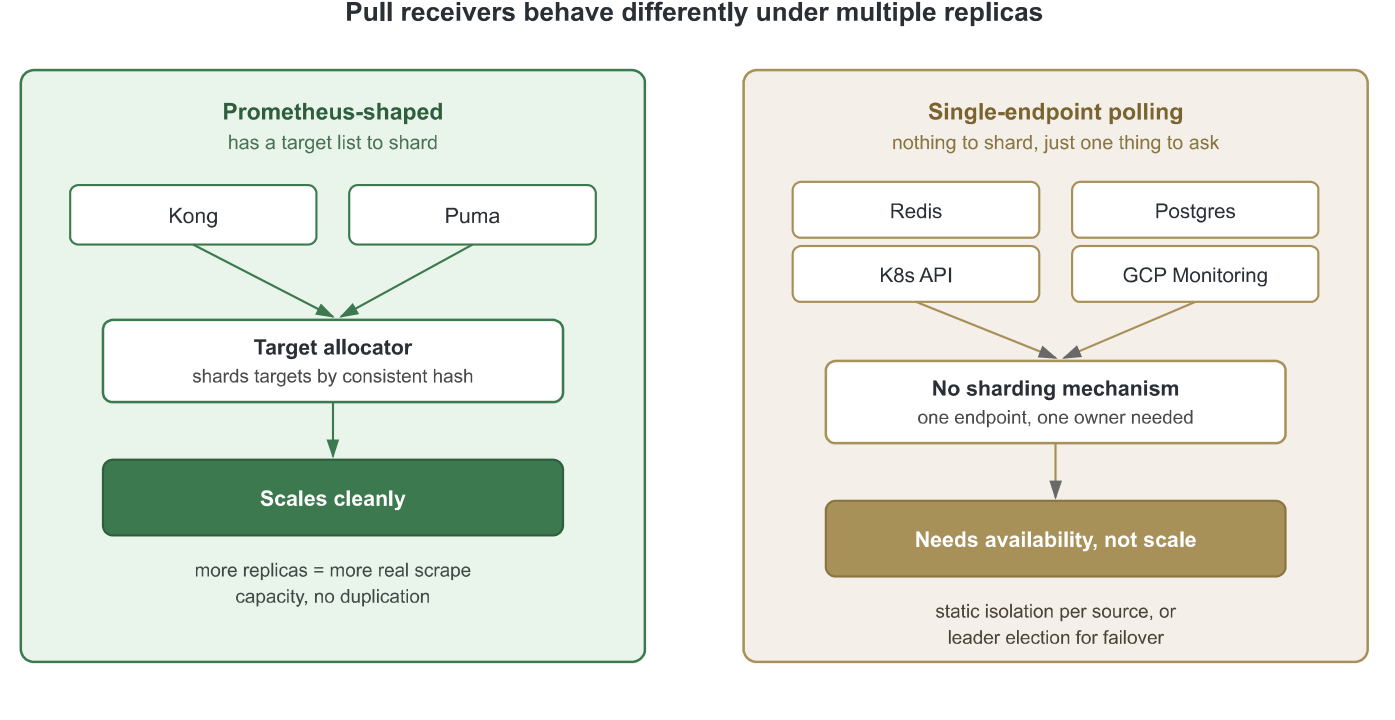
Kong and Puma both expose metrics in Prometheus format, so assuming they're scraped through the standard prometheusreceiver , this is the case the OTel Operator's target allocator was built for, worth noting this means adopting the Operator's CRD-based deployment model, not just a config change: it shards a Prometheus-style scrape config across however many collector replicas you run, using consistent hashing so each target is owned by exactly one replica at a time, and reshuffles ownership if a replica disappears. This is genuinely a scaling mechanism, useful when there are enough targets that one collector can't handle the scrape and processing load alone. The honest reason to reach for the target allocator here isn't capacity, it's decoupling target ownership from the push tier's replica count.
Redis, Postgres, the K8s API, and GCP Monitoring are a different shape of problem, assuming they're running through their usual native receivers (something like redisreceiver , postgresqlreceiver, k8sclusterreceiver ,and a GCP-specific equivalent). These work by polling a single fixed endpoint on an interval, whether that's Redis's INFO command, a Postgres connection for table and query stats, the K8s API for a cluster snapshot, or the GCP Monitoring API. There's no list of targets to split up, just one thing to ask, repeatedly, and one collector asking it isn't under any real load, even with Postgres being the single largest source of samples in the whole pipeline. Run this on multiple replicas anyway and each one independently polls the same endpoint on its own timer, there's no coordination, so you don't get more capacity or failover, you just get N full copies of the same data landing at the backend at slightly different times. That's not a harmless quirk, it directly inflates storage and ingestion volume for zero added value. Whether it's cleanly recoverable afterward depends on the backend: Cortex, for instance, can deduplicate HA-pair scrapes by label at ingest, electing one replica as leader and dropping samples from the others in real time, though that requires the HA tracker explicitly configured, not something you get by default. Insert-only, ClickHouse-backed stores don’t have that option, every scrape lands as a new row with no dedup on write, which is why the duplication is difficult to undo downstream for a setup like this. As far as I'm aware, receivers like this weren't built with running multiple concurrent instances in mind, since there's nothing for a second instance to usefully do. A target allocator doesn't help either, because there's no scrape config for it to shard against, just one receiver instance either polling or not.
Kafka doesn't fit cleanly into either of these two buckets, which is worth flagging here even though it isn't part of this pipeline today. Kafka handles its own partitioning natively, so a kafkareceiver consuming from a topic scales more like the push side than like Redis or Postgres. It gets its own section further down, both because it deserves the fuller explanation and because, again, it isn't actually part of this setup yet.
What these four (Redis, Postgres, K8s, GCP) actually need is availability, not scale: if the one pod handling Redis or Postgres polling dies, something else should pick it up quickly, not have multiple pods polling at once in the meantime. Two approaches apply here, static isolation and leader election:
- Static isolation: Give each of these receivers its own small, dedicated single-replica deployment, isolated from both the push tier and each other. If one restarts, only that one source's data is briefly affected, nothing else.
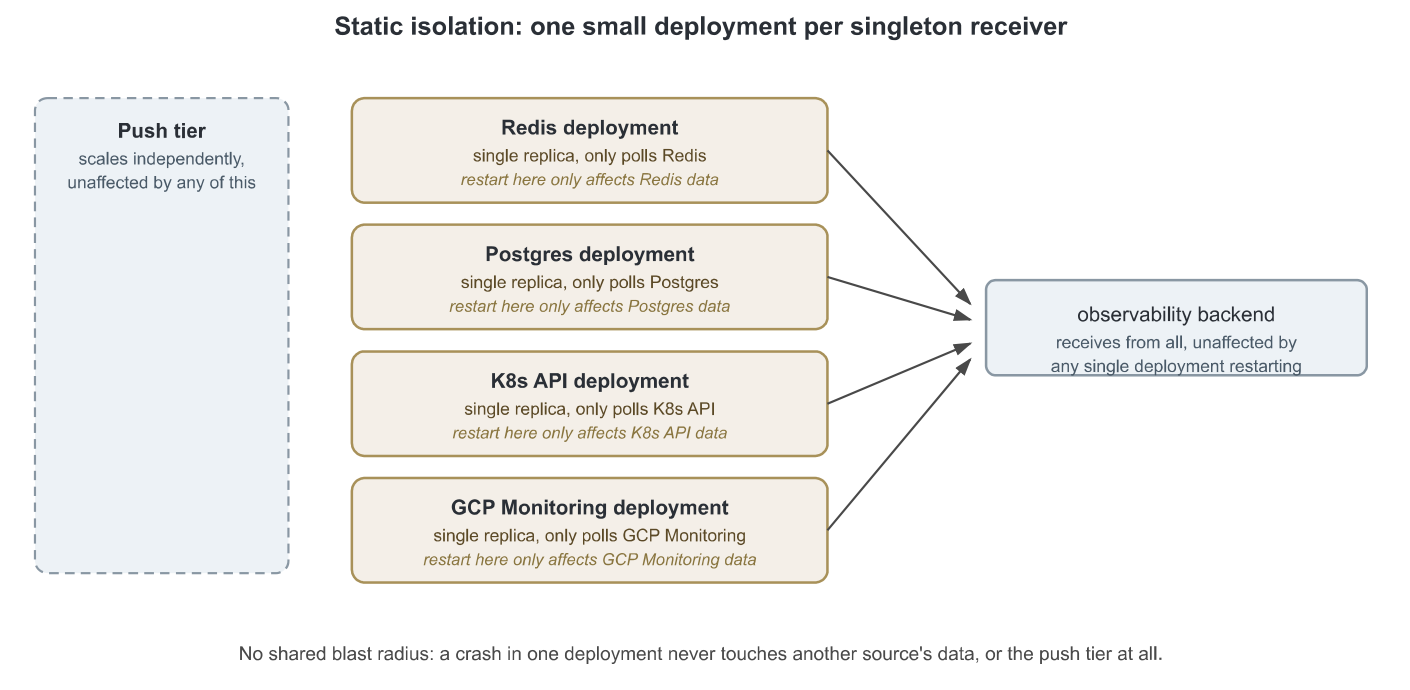
No shared blast radius: a crash in one deployment never touches another source’s data, or the push tier at all.
- Leader election: an extension or sidecar holds a lease, and if the active replica for a receiver goes down, a standby picks up scraping automatically, without both running at once, failover without duplication. For the K8s API source specifically, this is a real, documented option: the k8sleaderelector extension is wired into the receiver upstream, though it's still alpha stability, worth weighing against the added moving parts before relying on it in production. Redis and Postgres don't have this available today, their receivers have no equivalent support, so static isolation is what they run on regardless.
Given how few targets are in this category, static isolation per source is probably the less complicated place to start, with leader election as something to reach for later if the number of singleton-style sources grows enough that manual isolation gets unmanageable.
A separate case: Kafka
Kafka doesn't fit cleanly into either of the two buckets above, so it gets its own treatment here rather than being forced into one.
The reason it deserves its own section rather than a slot in the bucket above is that "the Kafka receiver" can mean two very different things depending on what it's pulling, and the two land in opposite categories:
- Polling broker or topic level metrics on a schedule behaves exactly like Redis or Postgres above: one fixed thing to ask, no coordination between replicas, more replicas just means more duplicate copies. This would go in the same isolation-or-leader-election bucket as the rest of the polling receivers.
- Consuming telemetry that's already been published onto a Kafka topic (traces, logs, or metrics pushed there upstream as a queue) is a genuinely different shape of problem, closer to push than pull. It rides on Kafka's own consumer group protocol, so multiple replicas sharing the same group ID automatically split the topic's partitions between them, and Kafka handles rebalancing on its own if a replica dies. No duplication, no manual sharding needed.
The first question worth asking for any Kafka pull setup is which of these two cases actually applies, since that decides whether it needs the same isolation treatment as Redis and Postgres, or whether it scales cleanly on its own the way push does.
The approach this points to
Putting the pieces together, here's the direction that makes sense:
- Back the sending queue with the file_storage extension, and set retry_on_failure.max_elapsed_time: 0 . Both are config changes, not architecture changes, and protect regardless of scale, worth doing first.
- Split push and pull into actually separate tiers, so the push tier can scale freely without touching how scraping works.
- Target allocator sharding for Kong and Puma. Static isolation for Redis, Postgres, K8s API, and GCP Monitoring, with leader election as an additional option for the K8s API source specifically, where it's documented and available today.
- Revisit what protects the push tier from node failure: how many replicas actually tolerate one node going down, whether the queue needs to be persistent regardless of replica count, does the PDB config still matter once replicas > 1, and what data-loss window we're actually targeting.
If you've solved this same push/pull scaling problem differently, we'd genuinely like to hear how.
Takeaways
A PodDisruptionBudget only protects against voluntary disruption. It says nothing about node failure, and minAvailable: N on an N replica Deployment barely does anything at all.
Push and pull scale in opposite directions, and not all of "pull" is even a scaling question. Prometheus-shaped pull needs exclusive target ownership, which a target allocator solves as a genuine scaling mechanism. Single-endpoint polling receivers were never a capacity problem, they need availability, not more replicas.
If you're designing this from scratch: decide up front whether push and pull belong in the same tier at all, and check which shape each of your pull sources actually is (Prometheus-style vs. single-endpoint) before assuming one fix covers all of them.